MOS / Modules / Production
OEE BY MOS
Running in production

OEE & Machine Monitoring

Every machine, live — and the real reason it stopped.

Machine statesOEE by shiftStop reasonsMTTR / MTBFShift report
See it on my machineSee the screen
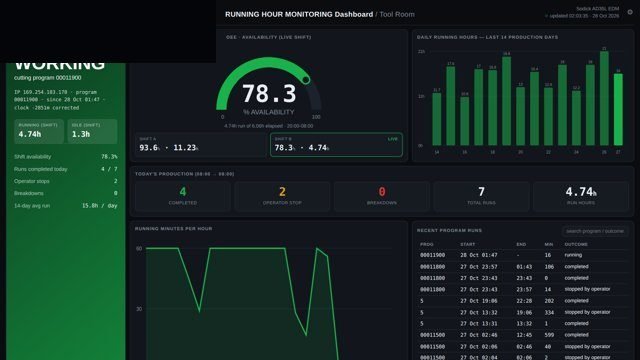
OEE & Machine Monitoring screen 1 in MOS
The screen

What it looks like in MOS

MOS reads the machine itself — its controller, its PC or the files it writes — and shows running, idle and alarm time per machine and per shift. Availability, performance and quality are worked out from what the machine reports, not from what someone remembers at the end of the shift. Stops carry their true cause, so the morning meeting talks about facts.

Download the one-pagerSee it on my machine
Product positioning

A shift report written from memory is not the plant

At the end of a shift someone writes down what ran and why it stopped. The machine knew the real answer every second, and nobody asked it.

“MOS reads the machine itself — its controller, PC or files — and shows running, idle and alarm time, counts and cycle times, rolled up by shift, day and month, with the true reason for every stop.”
Today
MachineOperatorShift sheetMorning meetingwritten from memory
With OEE & Machine Monitoring
MachineGatewayMOS EdgeMorning meetingread every second

Drawn, not promised: the top row is how a stop reaches the morning meeting today — written on a sheet at the end of the shift. The bottom row is the same stop read from the machine the moment it happens, with its duration and its reason.

End-to-end flow

5 connected stages

Hover or tap a stage to see what is captured there.

01

Machine

Read
  • Controller / PC / files
  • Modbus TCP, OPC UA
  • FTP, CSV, Excel
02

States

Mapped
  • Running / idle / alarm
  • Planned stops
  • The plant's own reasons
03

Recorded

Every second
  • Counts, cycle time
  • Buffered if the link drops
  • On MOS Edge
04

Rolled up

Shift / day / month
  • OEE, A/P/Q
  • Losses by reason
  • MTTR / MTBF
05

Acted on

Alerts & reports
  • Long-stop alerts
  • Shift report by e-mail
  • Every plant, one view
Continuous threadMachine→States→Recorded→Rolled up→Acted on
Part of the platform

OEE & Machine Monitoring runs on MOS

Not a standalone tool — a product on the MOS platform, sharing one login, one set of people and roles, and one database with every other module. The lit layers are the ones this product uses; the signal path shows how data moves through them.

  • MOS Edge runs inside the plant — interlocks and screens keep working if the internet does not.
  • MOS Central is a one-way mirror for head office and every plant in one view.
  • Your IT never opens an inbound port.
MOS CentralEvery plant, one viewin use
MOS EdgeYour plant serverin use
MOS CoreThe operating layerin use
MOS ConnectMachine connectivityin use
MOS VisionAI on the line
Core engine & extensions

What is core, what extends it, what is not claimed yet

The honest map, drawn as one thread. Filled nodes are in the product today; outlined nodes are other MOS modules on the same platform; dotted nodes are roadmap and never represented as available until built. Hover a node.

● Core

● Core — in the product today○ Extension — another MOS module◌ Roadmap — not claimed
Native engine

Core functionalities

Each card ends with the thing itself as it appears in MOS — not a description of it.

Connect

Read the machine as it is

  • Modbus TCP, OPC UA
  • Machine PC & files
  • No change to the machine
  • Buffers on link loss
Measure

Every second

  • States and counts
  • Cycle times
  • Plan vs actual
  • Per shift / day / month
Explain

Why it stopped

  • Stop reasons from the machine
  • Operator notes
  • Losses ranked by time
  • MTTR / MTBF
Act

Without typing

  • Long-stop alerts
  • Shift report by e-mail
  • 14-day trends
  • Every plant on one screen
Operational journey

7-step digital thread

Step through it or let it play. Each step: who does it, on what, what is captured, and the check that guards it.

Step 1 / 7
Step 1 · Commissioning

Connect the machine

MOS Connect reads the machine the way it already talks — controller over the network, its PC, or the files it writes.

WhereMOS Connect gateway
CapturedRaw signals, counts, cycle time
Guard / interlockNo change to the machine
● live in MOS
Where it sits

Your ERP or Tally runs the books. This adds the ground truth.

Your ERP / Tally typically givesOEE & Machine Monitoring adds
A shift sheet filled at the endMachine states recorded every second
Downtime from memoryStop duration and reason from the machine
OEE estimated monthlyOEE by shift, day and month, live
Breakdowns counted by handMTTR / MTBF from real stop times
Hardware & connectivity

Works with what a plant already has

Machines

Controller over the network (Modbus TCP, OPC UA), the machine PC, or the files it writes

Gateway

MOS Connect on the machine network; buffering if the link drops

Server

MOS Edge in the plant; MOS Central for every plant in one view

Signal tap

For a machine with no readable state, a simple signal tap

At a glance

The spec

What it connects to, where it runs and what it gives you — the short version your IT and your plant head both want.

ReadsPLC/controller (Modbus TCP, OPC UA), machine PC, files (FTP/CSV/Excel)
Runs onMOS Edge — your plant server
Needs on siteThe gateway on the machine network; nothing changes on the machine
OutputsOEE, availability/performance/quality, stop reasons, MTTR/MTBF, shift & monthly reports
Licensed byPer machine / per line
Capability transparency

What is built, what extends, what is not claimed

Core — today

Machine states, counts, OEE, stop reasons, alerts, shift & monthly reports.

Extension

MOS Energy (kWh per machine/part) on the same gateway; Vision Poka-Yoke at the same station.

Integration-dependent

Which protocol each machine speaks is confirmed at site; most expose state somewhere.

Roadmap

Predictive maintenance — not represented as available.

Capabilities depend on the plant's process and what is connected at site. Nothing on this page is represented as available until it is built and running.

What you get

6 outcomes

OEE from the machine, not a sheet True stop durations and reasons MTTR and MTBF you can trust Plan vs actual every shift Alerts before a stop becomes a shift loss One screen for every plant
Who uses it

Everyone sees what their job needs

Operator

Their machine's state and the reason prompt for each stop

Supervisor

Which machine is down right now, and why

Maintenance

Breakdown history, MTTR and MTBF from real stop times

Plant head

Shift and monthly OEE across lines

On site

What is needed in your plant

On the machine

Nothing changes. Its controller, PC or log files are read as they are.

On the network

The MOS gateway on the machine network, buffering if the link drops.

In the plant

The MOS plant server — screens open in any browser on the network.

Rollout

From the first day to the first month

Day one

First machine live

One machine connected and its states on screen.

Week one

Stops get reasons

Stop reasons agreed with production; shift report starts.

Month one

Every machine, one view

All machines on the floor view; trends and losses running.

Questions

Asked about OEE & Machine Monitoring

Our machines are old. Can MOS read them?

Most machines expose their state somewhere — a controller, a PC, a file or a signal. The gateway reads whichever one is there; for a machine with none, a simple signal tap is added.

Who enters the stop reasons?

The operator picks a reason once when the machine stops; the duration and time come from the machine.

Works with

The rest of MOS

On your own machine

See it on your own machine.

Tell us about your plant and what you want to see. We visit, connect one machine or station, and you watch your own data in MOS before anything is quoted.

  • A plant visit to see the line and the problem
  • One machine or station connected as a proof of concept
  • Your own data, live, on MOS screens
  • Scope, modules and timeline agreed in writing only after that
Thank you — request received.We will call you shortly to plan the visit.